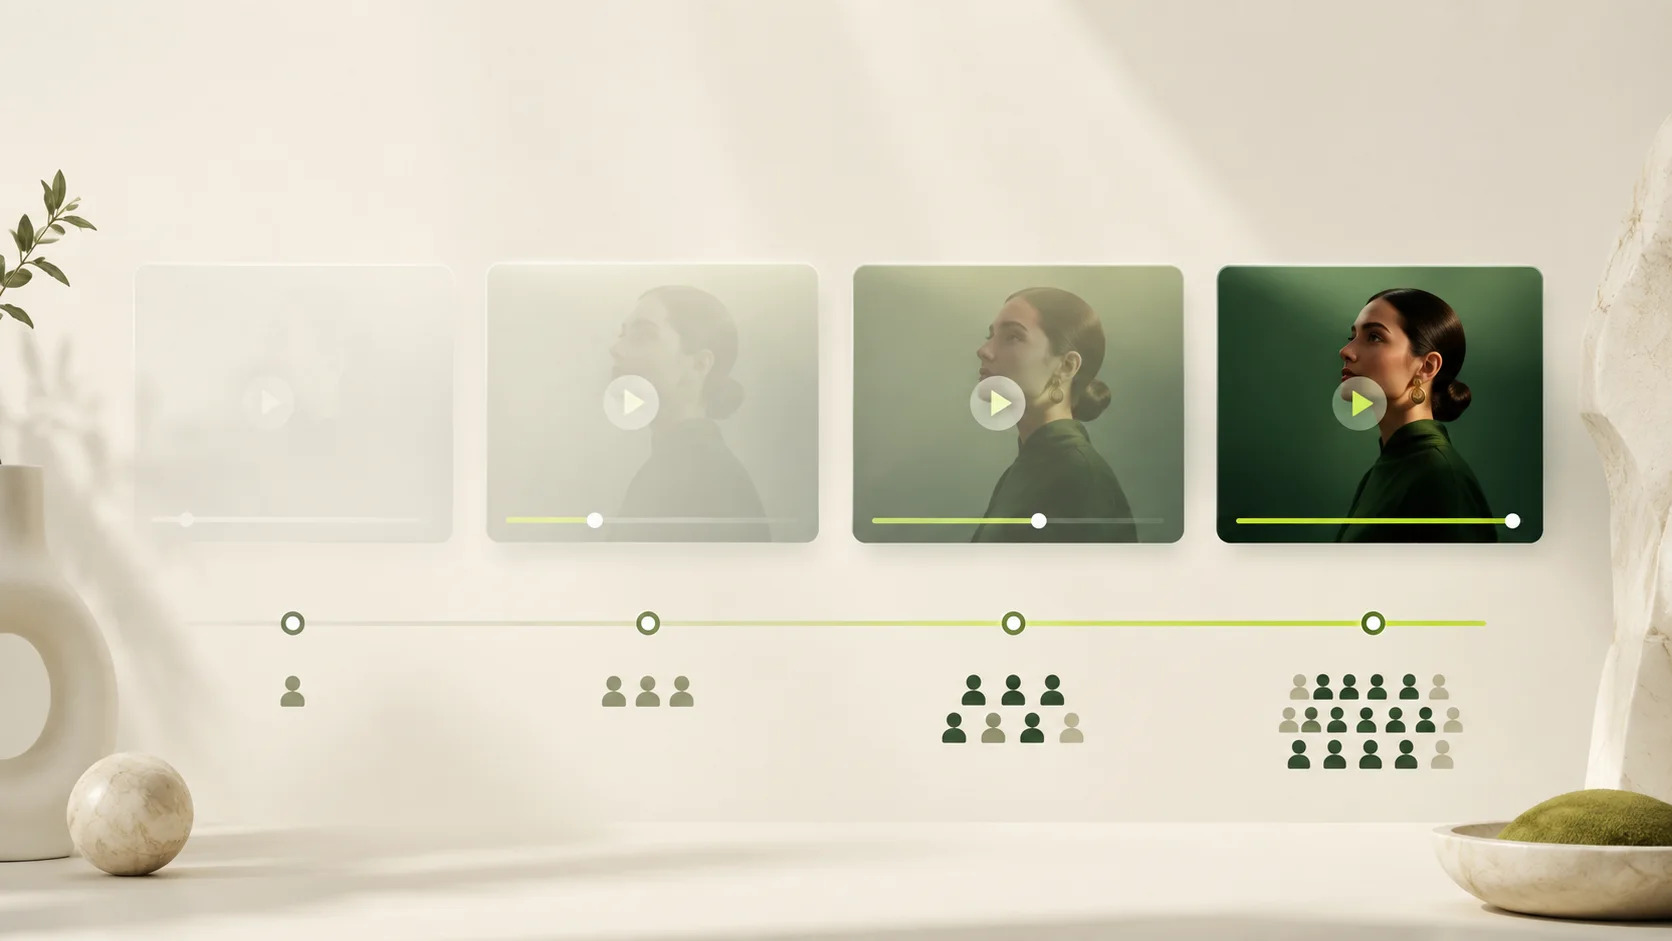
A video can appear on a page, begin playing and still fail to hold anyone's attention. Calling every one of those moments a “view” hides the difference between distribution and genuine interest.
A useful report keeps the stages separate. It shows how many people had the opportunity to watch, how many stayed long enough to count, and how many continued through the story.
Start with the opportunity to watch
An impression tells you that the player was actually shown on screen. It is the top of the viewing journey, not proof that somebody watched the video.
This distinction matters on pages with several videos, embeds below the fold or visitors who leave before pressing play. Page views alone cannot tell you whether the player was ever visible.
A qualified view requires attention
Visiroll counts a qualified view after at least three seconds of playback. Very short videos qualify after the viewer reaches almost all of their duration. This removes accidental starts and gives every report a more useful baseline.
The relationship between impressions and qualified views is your view rate. A low rate can point to an unappealing poster, weak placement, an unclear play button or a mismatch between the surrounding page and the video.
Engagement is a stronger signal
An engaged view is a qualified view that reaches ten seconds, or 25% for a short video. It shows that the opening earned more than a brief glance.
Compare engaged views with qualified views rather than impressions. That keeps the question precise: of the people who really started watching, how many stayed?
Completion needs context
A completion records a viewing session that reached the end. Completion rate is useful, but it should never be read without video length and purpose.
- A 20-second product teaser should usually complete more often than a ten-minute interview.
- A tutorial can succeed when viewers find one answer and leave before the end.
- A campaign video may need a strong call to action before its final frame.
Watch time and average percentage watched add that missing context. Together they show whether a smaller audience paid close attention or a large audience sampled only the opening.
Read the journey in order
- Impressions: Was the player seen?
- Qualified views: Did playback become meaningful?
- Engaged views: Did the opening hold attention?
- Progress milestones: Where did viewers leave?
- Completions: How many reached the end?
When a number changes, move to the next stage instead of guessing. Strong impressions with weak qualified views suggest a presentation problem. Strong starts with an early drop suggest an opening problem. Healthy retention with few impressions suggests a distribution problem.
Use one definition in every client report
Write the definitions beside the numbers and keep the date range, website and video filters consistent. That makes month-to-month comparisons credible and prevents a page load from being presented as a person who watched.
The goal is not to produce the largest view count. It is to show where attention started, where it held and what to improve next.